The New Oil Economy
When Colonel Drake discovered oil in Pennsylvania in 1859 it set the stage for the new oil economy. It started an age of innovation that brought us the internal combustion engine, central heating or plastics that have changes the world completely – not on all aspects, we will certainly be able to agree, for the good of humanity and the planet we live on.
Data is the new oil. I’m sure many of you have heard the quote that was coined already in the last decade, but only rose to prominence when the Economist picked it up in 2017 and told us that the world’s most valuable resource is no longer oil, but data. But to be honest it misses out on a very important aspect. If reduced to these five words, it simply picks up on the same mistakes we have made during the rise of big data. While the enormous amounts of data available also contain an enormous value, many of the data mountains that have been piled out in recent times are fairly useless since they do not provide any insights. Instead the solution – obviously – is structured data, i.e. data that can be used to open the doors to secret chambers full of insights and applicable knowledge that had been locked before. Without structure and context, data can be used to exemplify almost anything, but proves nothing. If you happened to read the interview my colleague Jochen did with the late Wolfgang Achtner you will know how easily data can be used to demonstrate that storks actually do deliver babies.
A powerful tool
Data – structured and used properly – is a powerful tool. Not only does it provide previously unknown truths. It is also an important instrument to get across a point in conversations of all levels. To extract value from data, on the other hand, it is necessary to translate into actionable insights, to create a setting upon which questions can be discussed and decisions be taken.
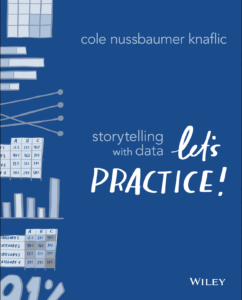
Both sides of this story require a form of storytelling with data. It is about visualizing data and communicate effectively with data. That was the subject of a book I read a few years ago, which helped me successfully implement data in presentations, so that it would go beyond mere numbers but underscore the arguments I am trying to make. While I have to admit that not everyone always agrees, it still provides for a solid foundation of a discussion and, more importantly, seems to make things more memorable. The book by Cole Nussbaumer Knaflic apparently was quite a success and has now sparked a successor that builds on the principles established in the first book. “Storytelling with data – let’s practice”, as the title implies, focuses on the practical aspects with examples, guidance and open-ended exercises.
A few simple steps and plenty of practice
The practical examples take you through a journey that seeks to explain the importance of understanding the context of any conversation and its targeted audience. It teaches an effective visual since data needs be presented in the right way (though there is no single right way, as you will learn) you create that magical moment of understanding that sometimes only a graph can deliver. It helps to identify and eliminate clutter as well as focusing attention to eventually tell a story effectively with data. There is always the temptation to make use of all the data that we have. At the same time, it comes with the risk to overburden the audience. Instead anything that doesn’t need to be there should be eliminated, while using thoughtful design steps in order to focus an audience on the right things. It isn’t rocket science but rather a case of understanding the different elements of constructing inspiring and influential stories that use insightful data.
“Storytelling with Data – Let’s Practice!” by Cole Nussbaumer Knaflic is published by Wiley and is available at Amazon or other book outlets.


